Digital barriers on Norwegian websites 2018
The Authority for Universal Design of ICT has surveyed the universal design status of 278 websites in the private and public sector in Norway. A total of 60% of the 26,818 individual tests produced results that indicate compliance with universal design requirements.
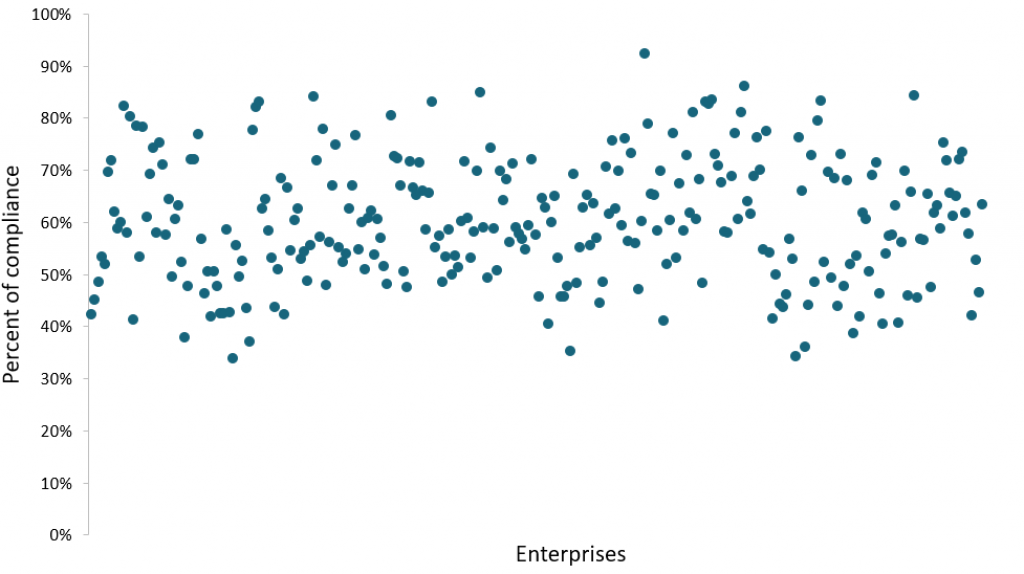
The results vary greatly between the websites. The best enterprises in the survey achieved 92% compliance with the universal design requirements. The poorest result was 34%. An average of 96 individual tests were conducted on each of the websites.
To score 100%, all the individual tests must comply with the universal design requirements. The figure below shows the percentage scores of the websites in this survey.
Figure 1: Results for websites. Percentage of test results in compliance with universal design requirements for ICT.
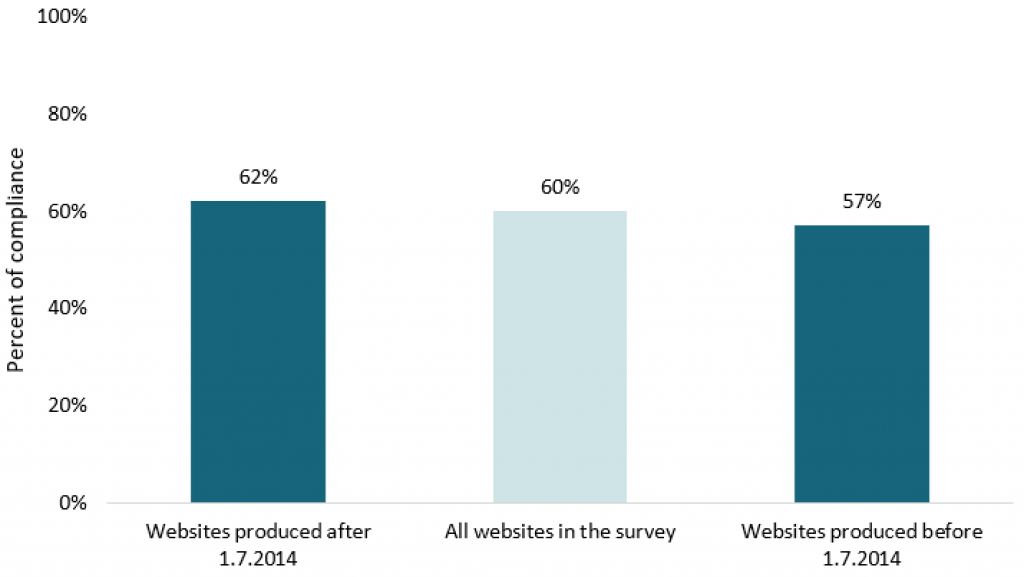
Websites that were procured or developed after the regulations were introduced in 2014, score better than the older websites in this survey. The overall result (60% compliance) indicates there has been an improvement since the previous survey in 2014. Even though the surveys are not directly comparable, the difference between the older and newer websites underscores that the status of universal design for websites has improved.
The figure below shows that the websites in the survey that were procured after 1 July 2014 score 62%, while older web-based solutions score 57%.
Figure 2: Percentage of test results in compliance with universal design requirements for ICT. Websites specified by procurement date.
Two thirds (68%) of the websites in the survey were procured after 1 July 2014 and are thereby relevant for supervision. Around 30% of the websites were either procured before the regulations were introduced or their date of procurement is unknown. This means that almost a third of the websites in the survey are currently not subject to universal design requirements. If these are upgraded prior to 2021, they must be designed in compliance with the regulations. From 2021, all websites must be universally designed.
The figure below shows the distribution of websites in the survey by procurement date.
Figure 3: Percentage of the websites in the survey that were either procured prior to or after 1 July 2014.

The results from this survey will be followed up by inspections of a sample of websites tested in the survey. In the inspections, we will emphasis on areas with high risk for barriers to digital inclusion.
3. Results for content type and functionality
This survey is based on a sample of 16 of the 35 requirements for web-based solutions from the WCAG 2.0 standard and the Regulations on Universal Design of ICT. For each website, the Authority selected test pages and test objects. Given that we assessed only a few pages on each website, the results should be viewed as an indicator – and not as the overall result - of the degree of compliance or non-compliance with the standard’s requirements.
The topics in the status survey were
- navigability
- keyboard navigation
- coding of content
- use of forms
- alternative formats for non-text content
Various tests were conducted for each topic. This is explained in more detail in the reviews of the topics.
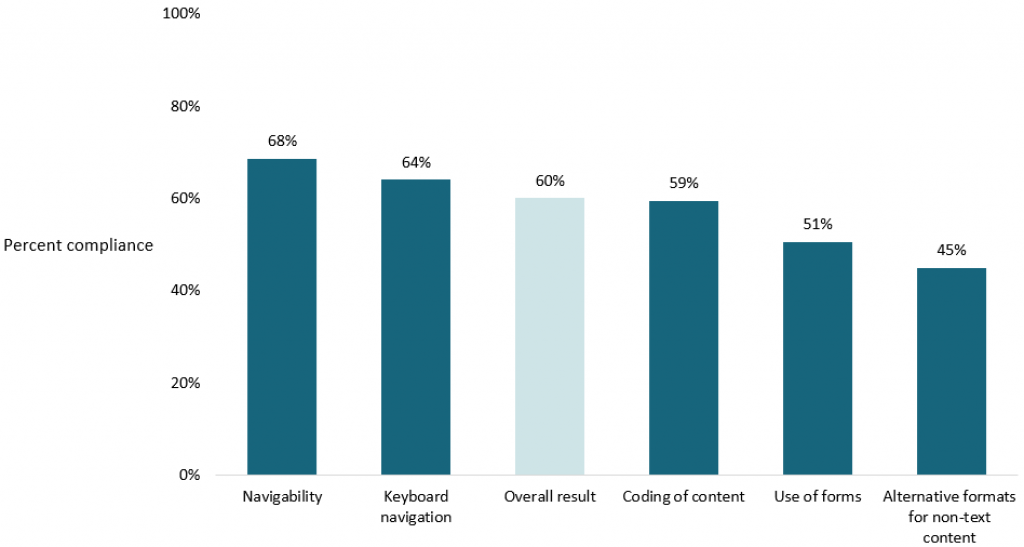
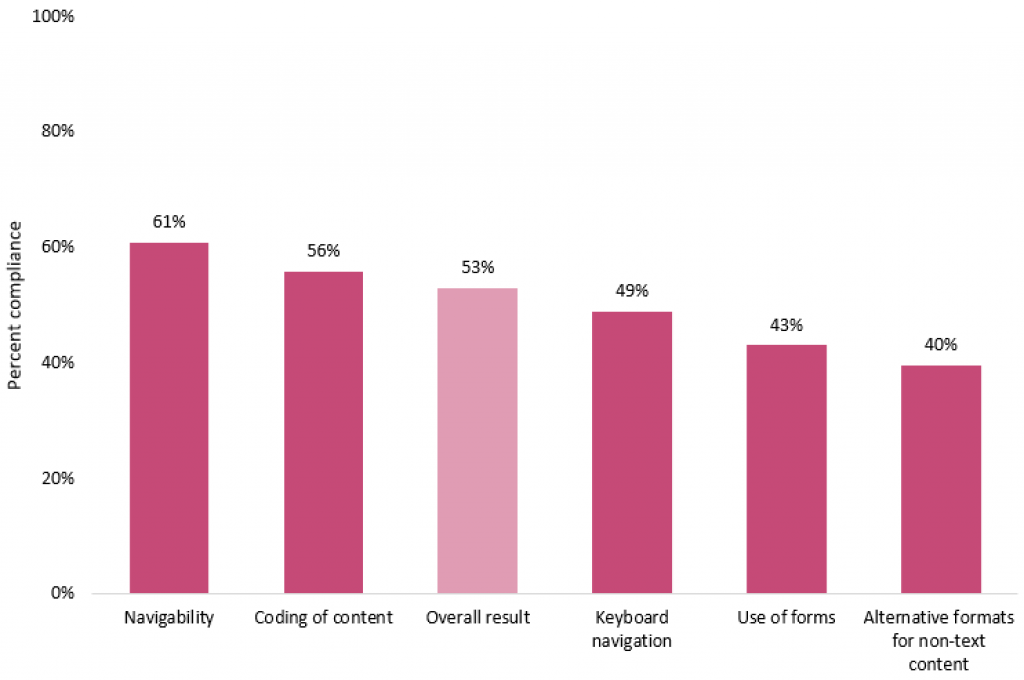
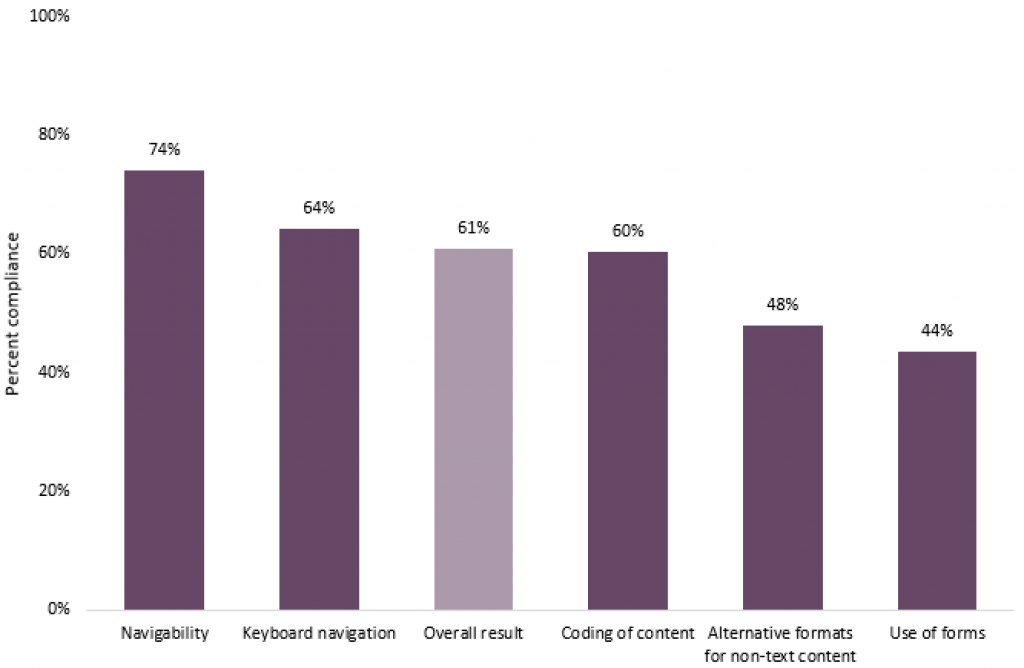
The same tests were conducted for all the websites in the survey. The figure below shows the results for the various topics in the survey. The results are given as percentage of individual tests indicating compliance with the requirements for each topic.
Figure 4: Percentage of test results in compliance with universal design requirements for ICT. Selected topics and overall results.
3.1 Test results for web page navigability
For the area of navigability, the tests in this survey covered:
- marking and formulation of links
- audio control
- contrast between text and background
- ability to enlarge content
- whether headings are descriptive
The figure below shows the results the websites achieved for "navigability".
Figure 5: Navigability. Percentage of test results in compliance with universal design requirements for ICT.
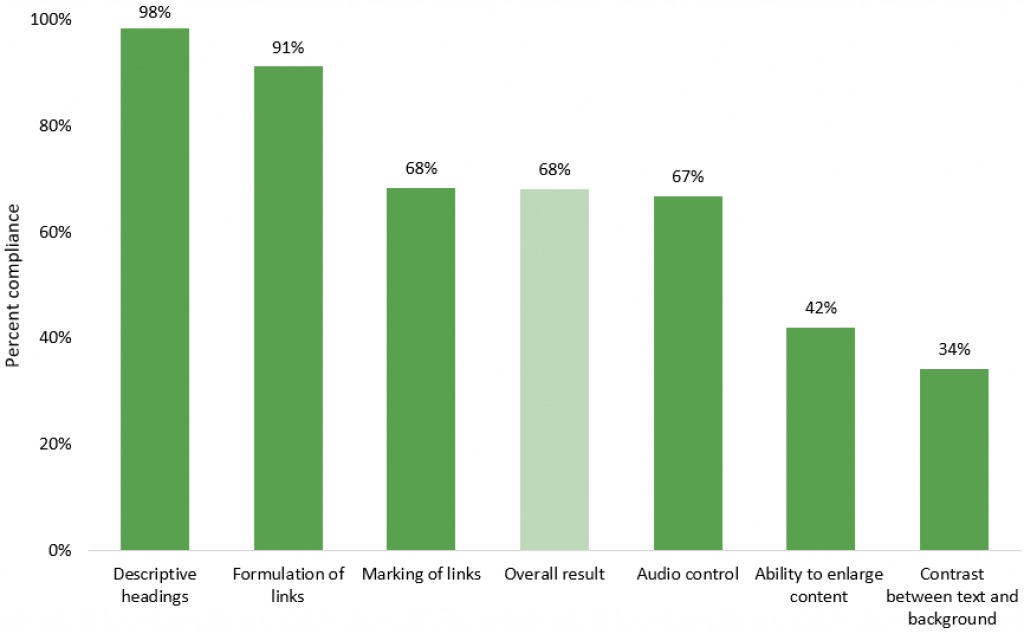
Although the overall test result for navigability is 68% compliance, the survey nonetheless indicates a fairly high risk of digital barriers in this area.
This is especially true for contrast between text and background. Contrast was measured on a total of 1,200 individual pages. Only one third (34%) of these are without contrast errors. Another result is that less than half (42%) of the web pages in the survey allow to enlarge web pages up to 200 percent without losing content or functionality.
Good contrast and the ability to enlarge content are especially important for the visually impaired. These requirements will also make web pages more user-friendly for everyone, irrespective of disability. Both requirements will be followed up in supervision.
Two of the requirements for navigability concern the formulation of headings and links. These are important requirements over which web publishers have full control. Both topics show very god results with 98% compliance for headings and 91% compliance for links.
Audio that starts automatically should be controlled by the user. Only three websites in the survey contain audio that starts automatically. Two of these websites comply with the requirements.
3.2 Test results for keyboard navigation
For keyboard navigation, tests were conducted to check whether:
- a keyboard can be used to access and use content and functionality
- the keyboard navigation focus indicator is visible
- there are keyboard traps when using a keyboard
The figure below shows the results the websites achieved for “keyboard navigation”.
Figure 6: Keyboard navigation. Percentage of test results in compliance with universal design requirements for ICT.
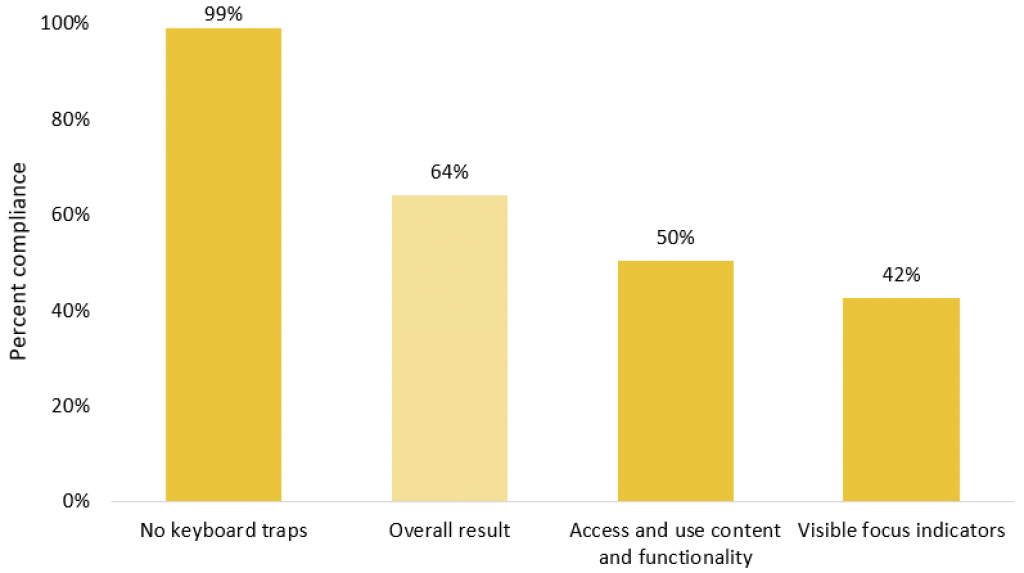
The results for keyboard navigation are varied. The fact that keyboard traps were barely registered on the websites in this survey is an important result. If web pages are designed in such a way that one “gets stuck” in content elements, it is impossible to use the website with a keyboard. This requirement is especially aimed at helping the blind, the visually impaired and those with motor skill impairments.
The requirement that the user should be able to access and use content and functionality by keyboard was complied with on just half (50%) of the tested pages. Less than half (42%) of the websites have visible focus indicators. Based on these results, the Authority regard keyboard navigation as a risk area that will remain a relevant topic for supervisions.
3.3 Test results for the coding of content
The coding of content should make websites accessible to users of assistive technologies. This applies to the blind, severely visually impaired, deaf blind and people with dyslexia who can benefit from using text-to-speech tools.
The requirement is intended to ensure that the coding addresses visual presentation. Different types of content e.g. form elements, should be identified and the coding must not contain syntax errors. The sample of requirements in this survey covers:
- coding of lists
- coding of headings
- coding of form elements
- coding of buttons
- coding syntax
- coding of tables
The figure below shows the results the websites achieved for the various tests within “coding of content”.
Figure 7: Coding of content. Percentage of test results in compliance with universal design requirements for ICT.
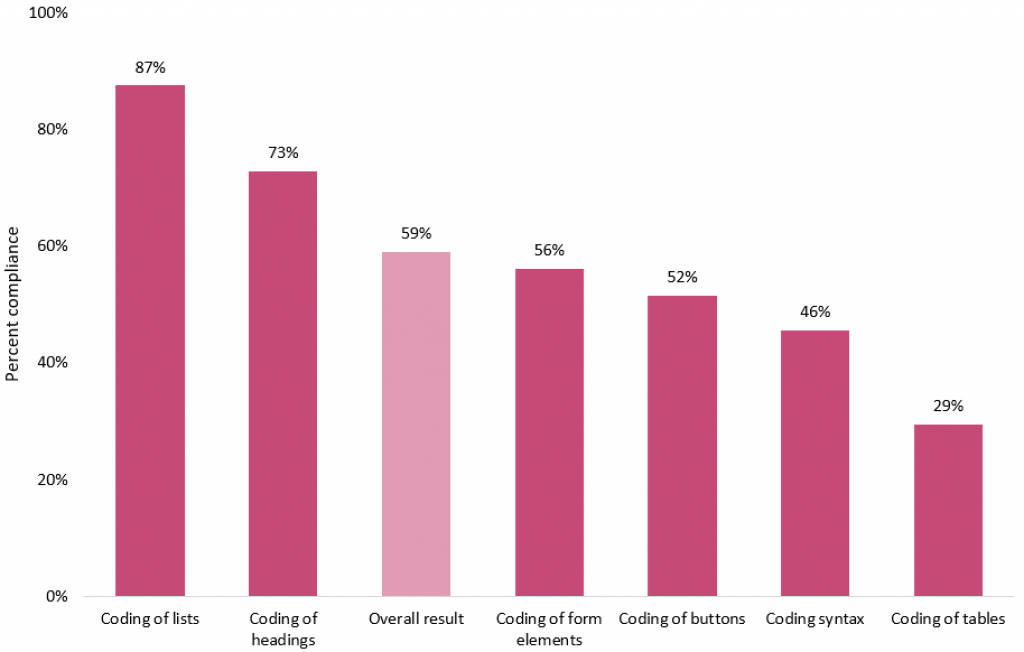
There were great variations in the survey with respect to the coding of different types of content. The results for coding of headings (73% compliance) and lists (87% compliance) were good. This indicates that visual headings and lists will to a large degree be presented in the correct manner with use of assistive technology.
The coding of the tables tested in the survey achieved a very poor result (29% compliance). Tables are often used to sort complex information. When tables are not coded correctly, the information in the tables is not particularly accessible with respect to the use of, for example, text-to-speech tools.
This survey shows that the coding of form elements achieved a result of 56% compliance and coding of buttons achieved a result of 52% compliance. As above, this indicates that people who are dependent on assistive technologies may find it difficult to use forms.
Coding syntax was tested on around 1,200 web pages in this survey. Errors were identified on almost half of the pages (46%). This indicates that coding syntax and the coding of forms and tables are risk areas for digital barriers.
3.4 Tests results for the use of forms
The use of forms in this survey covered:
- labels and instructions in forms
- error messages in connection with mandatory form fields
The figure below shows the results the websites achieved for “use of forms”.
Figure 8: Use of forms. Percentage of test results in compliance with universal design requirements for ICT.
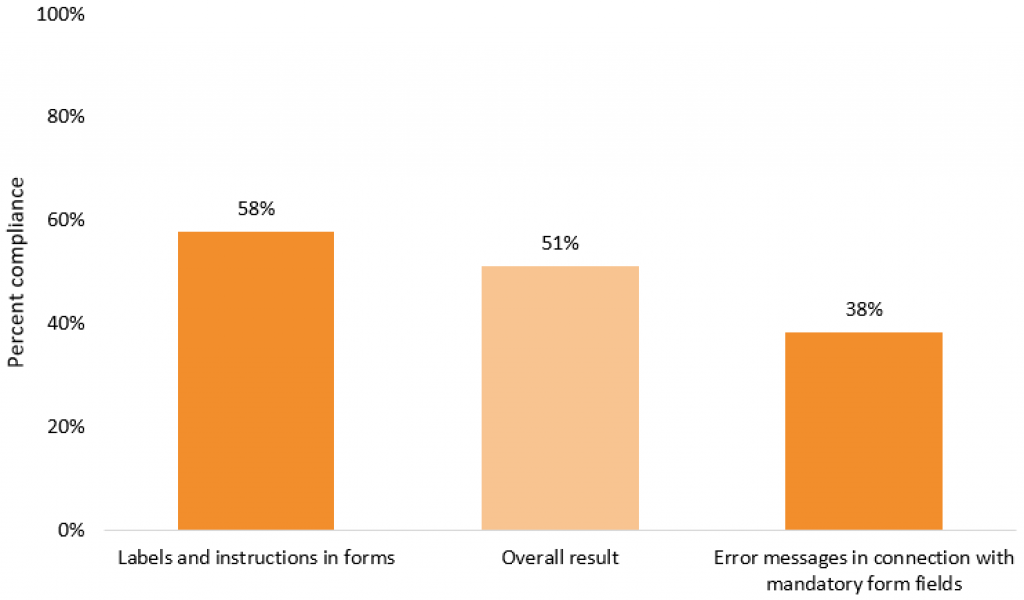
Digital forms are crucial for self-service on the Internet. Digital forms encompass for example logging in, ordering, buying, applications, contact forms, comment fields, sharing articles via social media, signing up for newsletters and more.
Forms are a risk area for digital barriers by virtue of being essential for equal participation and digital inclusion. Control of forms will therefore always be a topic in all the Authority’s supervisions. Only half (51%) of the labels, instructions and error messages tested in this survey were designed in compliance with universal design requirements for ICT. This indicates that many people find digital forms difficult to use.
The requirements for forms are intended to help a broad spectrum of user groups such as the blind, visually impaired, colour blind, deaf blind and people with motor skill impairments and impaired cognition. Universally designed labels, instructions and error messages will generally be more user-friendly for all users. This is very important, especially given an aging population that will most likely need to adapt to a greater degree of self-service.
Universally designed forms are intended to contribute to equal participation in many areas of society. Enterprises offering goods and services via the Internet should also be interested in reaching as many people as possible.
3.5 Test results for alternative formats
The regulations set a requirement that non-text content must be presented in an alternative format. In this survey we have assessed whether
- text alternatives describe images and illustrations
- text alternatives and link text describe purpose
- captions or other text alternatives convey the content of videos
The figure below shows the results the websites achieved for “alternative formats”.
Figure 9: Alternative formats. Percentage of test results in compliance with universal design requirements for ICT.
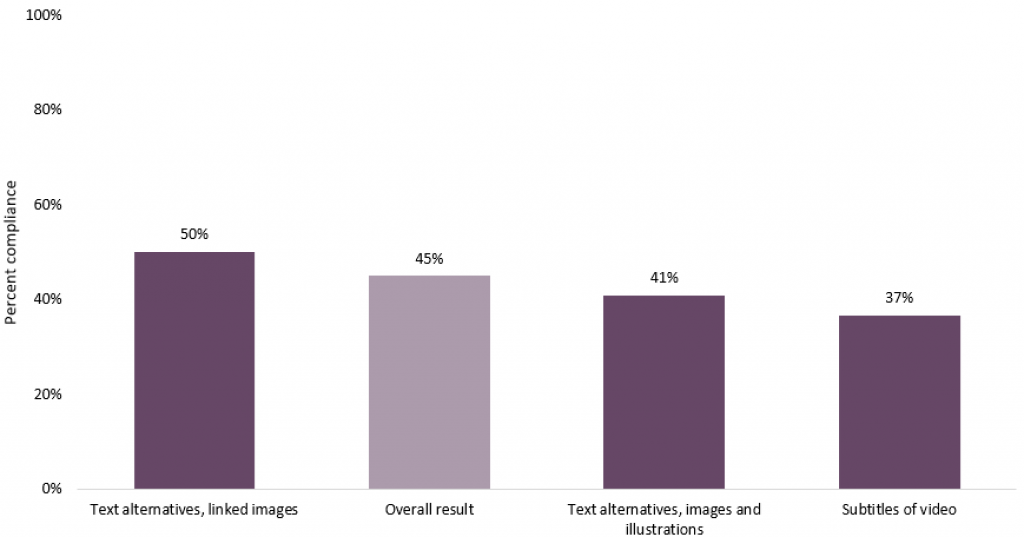
The requirements for images and illustrations, linked and unlinked, are that they should have text alternatives in the coding that describe the content. Complex illustrations such as diagrams or organisation charts must also have textual explanations on web pages. The requirements are primarily designed with a view to the use of assistive technologies, although the requirement for textual explanations on the same page as, for example, a computer diagram, makes the information content more accessible for all user groups.
Pre-recorded videos should have captions synchronised with the video. If this is not available, the video should have another text alternative. Both speech and other information in the video should be communicated. On the websites included in the survey, around one third (37%) of the videos have captions or another text alternative in compliance with the requirement. The requirement is primarily intended to help the deaf and hearing impaired but can also make this type of media content more accessible for all users.
A total of 2,791 tests of illustrations and videos were conducted in the survey. Given that less than half (45%) of these comply with the requirements, images and videos may not be accessible for many user groups. Alternative formats are regarded as a risk area for digital barriers.
4. Results for websites in various areas of society
The results from the survey may indicate that the test results for websites in the public sector are overall better than the results for those in the private sector, although strictly speaking the results cannot be generalised. The overall results for websites in the public sector show 65% compliance, compared with 57% compliance in the private sector.
A previous survey shows the same tendency. The Authority’s survey of familiarity with the regulations in 2015 indicates greater awareness of the regulations in the public sector than in several commercial groups in the private sector. To some extent, this may explain why the results appear to be better in the public sector. The figure below shows the overall test results for the websites, specified by public and private sector.
Figure 10: The percentage of test results in compliance with universal design requirements for ICT, in total and by private and public sector.

There is great variation between the organisations included in the survey, both in the private and the public sector. The results for the organisations in the private sector vary from 34% to 86% compliance, while the variation for the websites we tested in the public sector was from 35% to 92% compliance. The variations in the results between the websites are illustrated in the figure below.
Figure 11: Results for the websites. Percentage of test results in compliance with universal design requirements for ICT within various areas of society.

4.1 Online newspapers and other media websites
Media websites have large volumes of users. The universal design of media websites is therefore important for large user groups. The survey assessed seven of the ten online newspapers that, according to figures from Medianorway, are the largest in the country. Larger regional newspapers and other larger news providers were also tested. The survey also included some local newspapers.
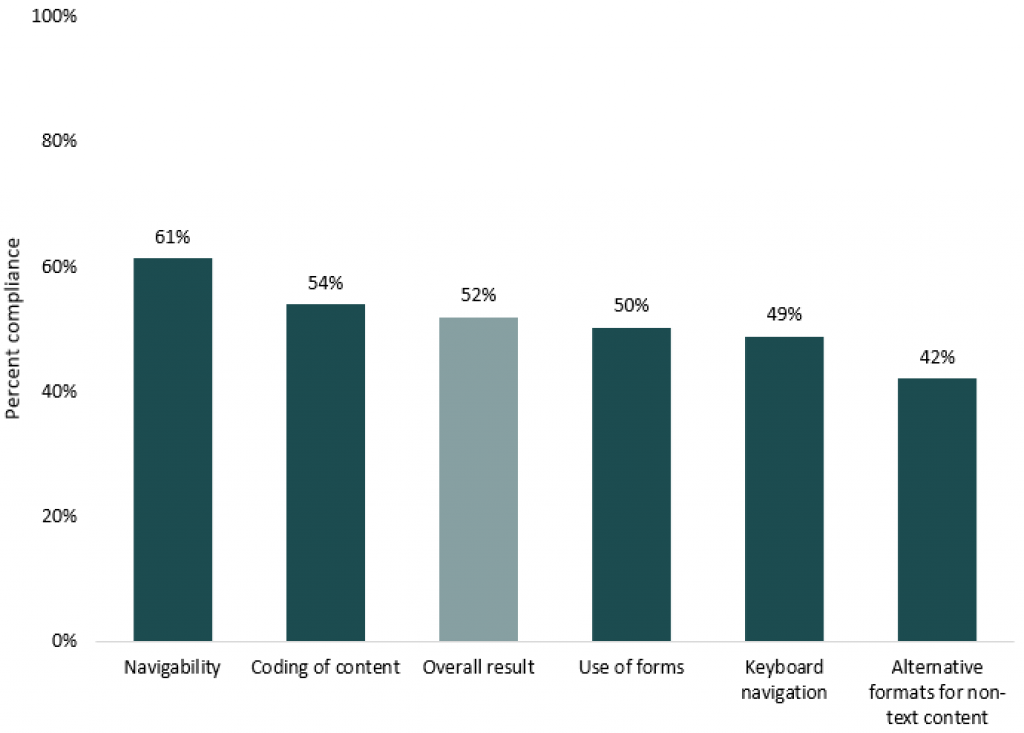
2,525 individual tests were conducted on a total of 25 media websites. Around half (53%) of the tests produced results in compliance with universal design requirements. This is shown in more detail by the figure below.
Figure 12: Media. Percentage of test results in compliance with universal design requirements for ICT. Selected topics.
Videos are an important part of the news. The regulations set requirements regarding alternative formats for non-text content. This means that videos must have captions or have other text alternatives. 29 pre-recorded video clips on media websites were tested in the survey; of these only 10 had captions or text alternatives in compliance with universal design requirements.
Forms on media websites largely encompassing buying subscriptions, comment fields, sharing articles on social media, signing up for newsletters and more. The overall score for the tests of coding for form fields, error messages and background texts were 46% compliance with the requirements.
The media websites, especially the large, national and regional online newspapers, have a lot of content and are updated frequently. Navigability has a big impact on user experience. Good contrast between text and background is very important for both navigability and access to information.
Contrast was measured on 116 pages on 25 media websites. Only 14% of these pages were in full compliance with the requirements.
Other navigability requirements cover the ability to enlarge web pages without losing content and functionality. The result in this area was 30% compliance. The content of headings and links is also important for navigability. In these areas more than 90% of the test objects complied with universal design requirements. Overall, the media websites tested score 61% for navigability.
Keyboard navigation is a major challenge for the media websites in the survey. 102 web pages were tested. It is possible to access all content using a keyboard only on 27% of the tested pages. The result for focus indicators was 24% compliance. These are serious barriers for those who use keyboards as a means of navigation.
The media websites have a great number of users and are therefore important for equal participation in society. Together with the overall results for the media websites in the survey, this indicates that the media sector is a risk area for digital barriers.
4.2 Web shops
Online shopping is growing strongly. The retail report from the Enterprise Federation of Norway (Virke) for 2017/2018 (in Norwegian) shows that online shopping is growing significantly more than high street shopping. According to figures from Statistics Norway (in Norwegian), online shops in Norway sold for more than NOK 21 billion in 2017, which represents year-on-year growth of 13.5%. This makes universal design important, both for sellers and buyers.
A total of 2,303 tests were conducted on 22 web shops in the status survey. Around half (52%) of the tests show compliance with universal design requirements for ICT. The sample encompasses large enterprises in the wholesale and retail trade that all have large volumes of online sales within sports articles, clothing, electronics, furniture, interior articles and more.
In addition, there are also 11 enterprises within the areas of electricity supply and Internet and mobile telephony provision. The results show 53% compliance when we look at the websites tested in the wholesale and retail trade, electricity supply, Internet providers group together. The figure below contains more information about the test results.
Figure 13: Wholesale and retail trade, electricity supply, Internet providers. Percentage of test results in compliance with universal design requirements for ICT. Selected topics.
Forms are especially important for online shopping. Forms are used for logging in, purchasing, contact with the web shop, signing up to newsletters and more. Only half (50%) of the tests related to forms produced results in compliance with universal design requirements. The biggest challenges involved
- labels and instructions
- error messages
This could potentially make it difficult for many users to shop online. Not everyone can shop in high street shops. Online shopping is therefore an important alternative that can help users shop efficiently and independently. This has also been pointed out in the dialogue the Authority has had with user organisations.
The wholesale and retail trade often use video for marketing and product information. Of the 25 videos in this survey, only nine have captions or a text alternative in compliance with universal design requirements. Images are also used a lot in the presentation of products. The regulations require images to have a text alternative that communicates the information provided in the image. This can be vital with respect to accessing the content via the use of assistive technologies.
For example, an image of an item of clothing should have a text alternative that provides the same information one can see in the image, such as the type of clothing, colour and cut. A third of the approximately 100 images we tested in web shops had a satisfactory text alternative.
Many web shops have large and complex websites with an extensive range of products. Simple, user-friendly navigability should ensure that as many people as possible can use the web pages. The web shops score 60% in this area. There were challenges especially in relation to:
- ability to enlarge content
- link marking
- contrast between text and background
The test results also uncovered challenges in accessing the web shops by using a keyboard. Overall, the web shops achieved 45% compliance on keyboard navigation. Only 20% of the tested web pages complied to the requirement that it should be possible to access and use content and functionality using a keyboard. Only 13% of the web pages have visible keyboard navigation focus indicators.
The Authority regards web shops as a risk area for digital barriers. The reason is that online shopping is growing strongly, both in terms of sale and numbers of users. In addition, the Authority has identified some weak results for universal design of web shops included in this survey.
4.3 Culture, leisure and organisations
The websites in this category encompass cultural institutions, recreational provision, non-profit organisations and interest organisations within education and working life. Equal opportunities to participate in cultural life, organisations and leisure activities are very important for equal participation in society.
A total of 3,213 tests were conducted on 33 websites. The overall result for this group was 55% compliance with universal design requirements for ICT. The results for the websites in these areas are presented in the figure below.
Figure 14: Culture, leisure, organisations. Percentage of test results in compliance with universal design requirements for ICT. Selected topics.
The websites tested in the culture, leisure and organisations group achieved quite poor results on the areas of navigability and keyboard navigation. This is especially true with respect to
- contrast between text and background
- link marking
- keyboard navigation focus indicators
Using forms is also a challenge. The result for using forms was 44% compliance. 165 mandatory form fields were tested on the websites in this group and only a third displayed an error message when users made an error. Half of the form fields have inadequate labels and instructions.
Fairly comprehensive deficiencies were also detected in text alternatives for illustrations (34% compliance) and video captions (39% compliance).
4.4 Transport, travel and accommodation
The transport sector, travel operators and hotels generally encourage online booking and purchases. Figures from Statistics Norway show that more than 60% of the general public aged 16 to 79 have purchased and booked travel and accommodation online in 2018.
A total of 2,654 tests were conducted on 27 websites within the area of transport and accommodation. The result was 57% compliance with universal design requirements. This is described in more detail below.
Figure 15: Travel and accommodation. Percentage of test results in compliance with universal design requirements for ICT. Selected topics.
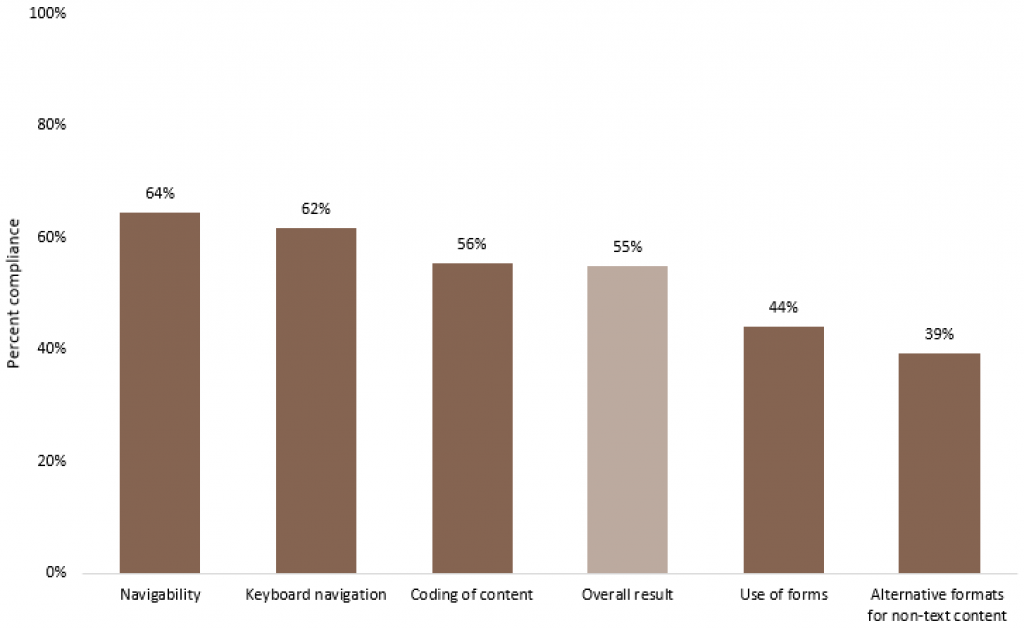
A total of 3,907 tests were conducted on 39 websites in the area of banking, insurance and other commercial service provision. A total of 26 of these enterprises operate within the area of banking and insurance, and we focused on including most of the major enterprises in this service area. 13 of the 39 enterprises operate within other commercial service provision such as estate agency and recruitment.
The overall result for the tested websites in this group was
61% compliance. The websites within banking and insurance appear to have achieved a better result (64% compliance) than other commercial service provision (54% compliance). The results are described in more detail in the figure below.
Figure 16: Banking, insurance, other commercial service provision. Percentage of test results in compliance with universal design requirements for ICT. Selected topics.
The websites within banking, insurance etc. achieved a relatively good result for navigability (74% compliance). On the other hand, the requirements for captions on videos and text alternatives for illustrations and images were addressed by half (48%) of the test objects.
The result for the coding of content was on a par with the overall result for the survey. Nonetheless, it is worth mentioning that syntax errors in the coding were identified on two thirds of the pages (67% non-compliance and 33% compliance). This means that the websites are difficult to use with assistive technologies.
Using forms is also challenging for the websites in the banking, insurance and other commercial service provision group in the survey. This is especially true with respect to:
- labels and instructions
- error messages
The forms in this section are regarded as a risk area for digital barriers. This is due to the high degree of self-service and very large volumes of users. Inadequate universal design can potentially prevent many users from completing necessary services and reduce opportunities for equal participation in society.
4.6 The education sector
The Regulations on Universal Design of ICT were expanded to apply to the education sector from 1 January 2018. New ICT solutions in primary and lower secondary schools, upper secondary schools and higher education must be universally designed from 1 January 2019.
This survey assessed the websites of primary and lower secondary schools, upper secondary schools, universities and university colleges. Every county is represented. Learning platforms and digital learning resources were not included.
A total of 3,655 tests were conducted on 42 websites in the education sector. These are distributed as follows:
- 19 primary and lower secondary schools
- 11 upper secondary schools
- 12 universities and university colleges
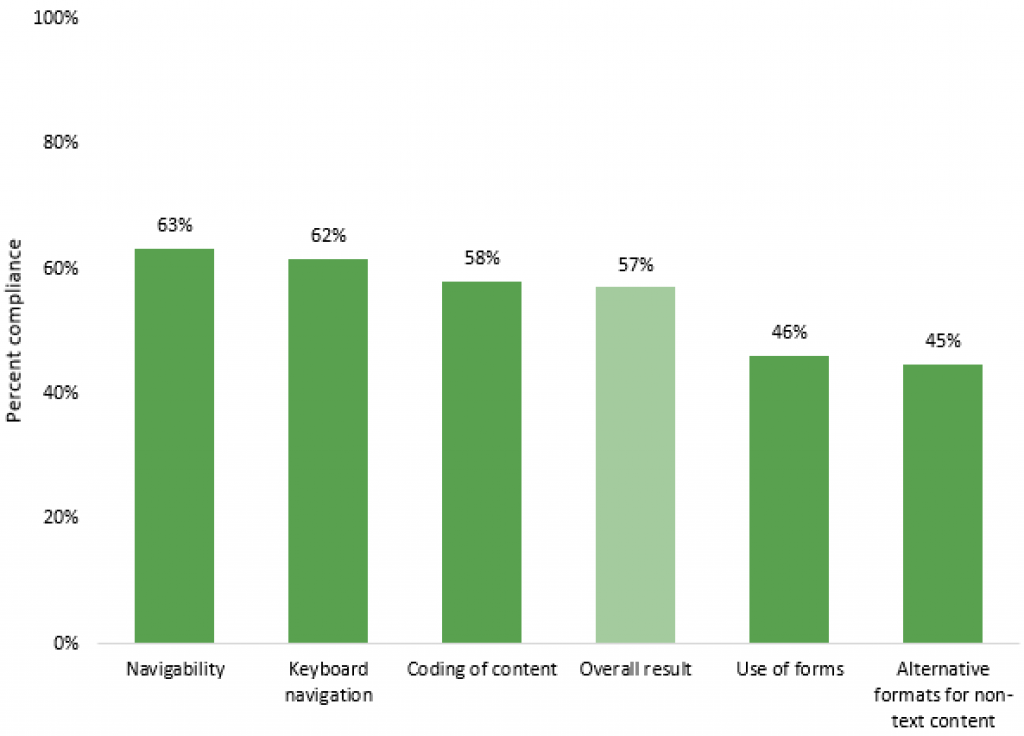
The overall result for the websites in the education sector included in the survey was 61% compliance. The results for the different topics in the survey are presented in the figure below.
Figure 17: Education. Percentage of test results in compliance with universal design requirements for ICT. Selected topics.
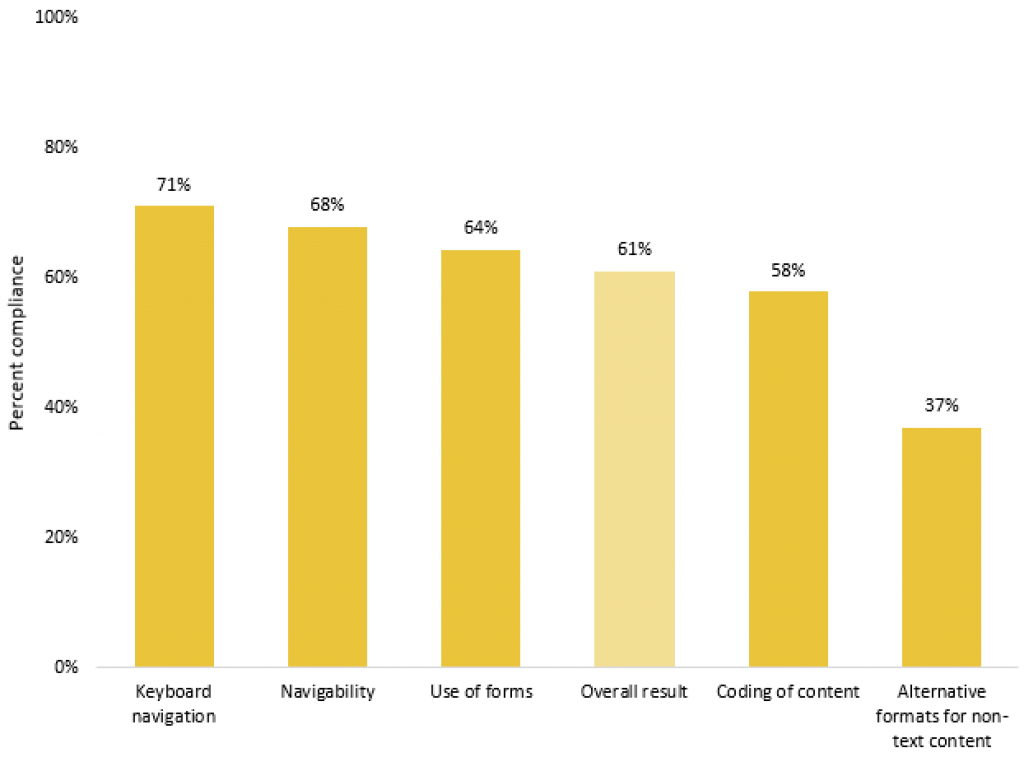
The websites we have tested in the education sector achieved a relatively good result in the use of forms (64% compliance). The result for keyboard navigation was 70% compliance.
Alternative formats achieved the poorest result for the websites in the education sector with only 37% compliance. For captions or other text alternatives for videos the websites scored 38%. Inadequate compliance was especially identified on the websites of upper secondary schools and universities and university colleges in the survey.
It is important to emphasise that the web solutions in the education sector were not subject to universal design requirements at the time of testing. The sector was included in this survey to gain an initial overview. In the future, the Authority will focus on the education sector with a special emphasis on digital learning solutions and learning platforms. Universal design is especially important for these types of web-based solutions in view of equal rights to education.
The education sector is regarded as a potential risk area for digital barriers based on its essentiality for very large user groups.
4.7 The health and social services sector
The websites in the health and social services sector are found in both the private and the public sector. The group encompasses public health trusts and private operators in the health and social services sector.
1,767 tests were conducted on 21 websites. 65% of the tests showed compliance with universal design requirements. The figure below shows the results for this topic in the survey.
Figure 18: Health and social services. Percentage of test results in compliance with universal design requirements for ICT. Selected topics.
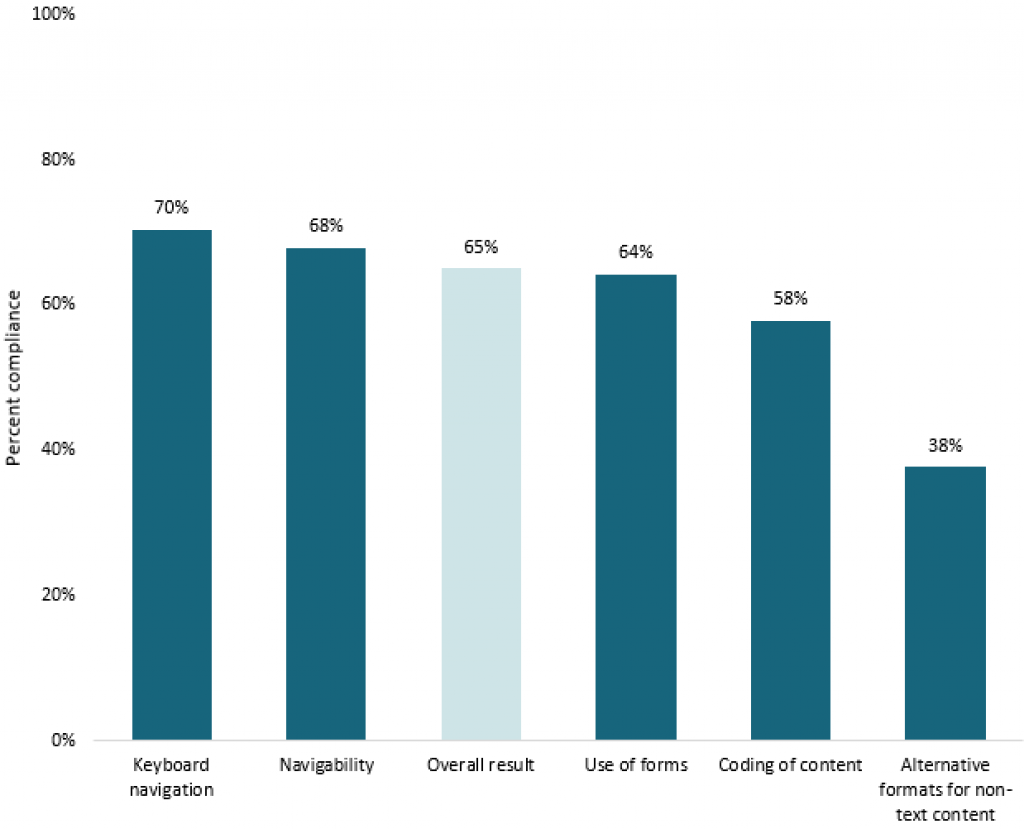
The websites we tested in the health and social services sector achieved poor results for the use of forms. 62 tests were conducted of
mandatory form fields and only 11 displayed an error message in compliance with the requirements. Around half (55%) of the forms have satisfactory instructions and labels. This creates barriers to self-service and thereby reduces the accessibility of the websites.
Relatively good results were measured for navigability (80% compliance). The requirements for navigability such as
- contrast between text and background
- formulation of links
- ability to enlarge content
- descriptive headings and labels
encompasses a huge number of usage situations and users with differing requirements. The requirements for keyboard navigation were well addressed (78% compliance).
Figures from Statistics Norway show that around two thirds (65%) of the general public aged 16 to 79 searched for health information online in 2018. Contact with health and social services often takes place during potentially vulnerable situations when it is important that people can orientate themselves and interact without having to rely on help from others. It is therefore important that these digital services are designed with the goal of equal access to information and equal opportunities for self-service in the form of, for example, booking appointments and other services.
4.8 Central government administration and service provision
In this group we conducted 5,725 tests on a total of 58 web-based solutions. The sample includes
- 29 municipalities and four county municipalities
- 25 government agencies
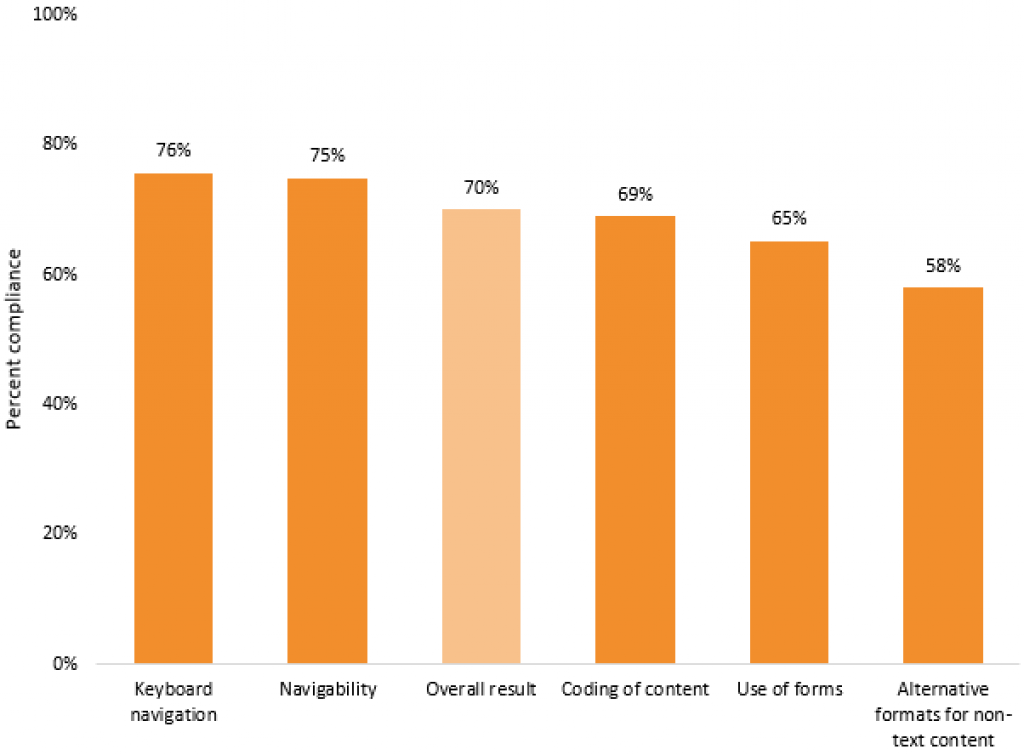
The overall result for these websites was 68% compliance with universal design requirements for ICT.
The results are described in more detail, grouped into municipalities and central government bodies. The test results for the local authorities in the survey are provided in the figure below.
Figure 19: Local authority administration and service provision. Percentage of test results in compliance with universal design requirements for ICT. Selected topics.

This survey includes municipalities from across the country. 3,231 tests were conducted on these websites. The results show 66% compliance. The best municipality scored 84%, while the poorest result was 46% compliance.
The municipalities scored relatively well in both the area of navigability (72% compliance) and keyboard navigation (71% compliance).
The result for using forms was somewhat poorer (63% compliance). For example, 260 mandatory form fields were tested and only around half of these provide error messages formulated in compliance with universal design requirements for ICT. Local authorities perform statutory duties in many areas. Most of the general public are recipients of local authority services and many of these services are provided based on applications from the general public. It is therefore very important that local authority websites have accessible self-service solutions.
In the area of alternative formats, the local authorities in the survey scored 51%. Around half (56%) of the tested images and illustrations have text alternatives in compliance with the requirements. Many local authorities publish videos of political meetings online. We tested 33 pre-recorded videos in the survey. Of these, only six had captions or a text alternative in compliance with universal design requirements for ICT. This will be followed up in supervisions.
The results for the websites tested in central government administration and service provision are shown in the figure below.
Figure 20: Central government administration and service provision. Percentage of test results in compliance with universal design requirements for ICT. Selected topics.
2,494 individual tests were conducted on these websites and the results show 70% compliance with the universal design requirements for ICT.